Showing posts with label consumer confidence. Show all posts

Wednesday, January 30, 2013

Robert Reich's Blog:


Why Consumers are Bummed Out


TUESDAY, JANUARY 29, 2013                                                                                 Original Here


The Conference Board reported Tuesday that the preliminary January figure for consumer confidence in the United States fell to its lowest level in more than a year.

The last time consumers were this bummed out was October 2011, when there was widespread talk of a double-dip recession.

But this time business news is buoyant. The stock market is bullish. The housing market seems to have rebounded a bit.

So why are consumers so glum?

Because they’re deeply worried about their jobs and their incomes – as they have every right to be.

The job situation is still lousy. We’ll know more this coming Friday about what happened to jobs in January. But we know over 20 million people are still unemployed or underemployed.

Personal income is in terrible shape. The median wage continues to drop, adjusted for inflation.

Most people can’t get readily-available loans because banks are still cautious about lending to anyone without a sterling credit history. (Eliminate student loans and you find Americans aren’t borrowing any more than they were a year ago.)

And the payroll tax hike has reduced paychecks for the typical American by about $100 a month. That’s just about what the typical family spends to fill up their gas tanks per month. Or half what they spend for groceries each week.

Contrast the current pessimism with consumer sentiment last October. Then, a majority polled by the Conference Board expected their incomes to rise over the next six months.

Now just 14 percent expect their incomes to rise, and 23 percent expect them to fall.

That 9 percent gap of pessimists exceeding optimists is the largest since the spring of 2009 when the Great Recession was almost at its worst.

The stock market is bullish because corporate profits are up, costs are down, the “fiscal cliff” agreement has locked in low taxes for most of the upper-middle class and wealthy, and there’s no sign of inflation as far as the eye can see.

But corporate profits can’t stay high when American consumers – whose spending is 70 percent of the U.S. economy – are this pessimistic about the future. They’re just not going to spend.

American companies won’t be able to make up the difference in foreign markets. Europe is careening into a recession. Japan is still in deep trouble. China’s growth has slowed.

Profits are the highest share of the U.S. economy on record. Wages are the lowest. But this imbalance can’t and won’t last.

Investors: beware.

Politicians: Don’t do any more deficit reduction. When consumers are this glum, austerity economics is particularly dangerous. 

If the next showdowns over the fiscal cliff, government appropriations, and debt ceiling result in more deficit cuts this year, we’re in a recession.

http://youtu.be/LCDufY-nKQw


ROBERT B. REICH, Chancellor’s Professor of Public Policy at the University of California at Berkeley, was Secretary of Labor in the Clinton administration. Time Magazine named him one of the ten most effective cabinet secretaries of the last century. He has written thirteen books, including the best sellers “Aftershock" and “The Work of Nations." His latest, "Beyond Outrage," is now out in paperback. He is also a founding editor of the American Prospect magazine and chairman of Common Cause.


Thursday, February 02, 2012

HOW I LOVE GRAPHS. EDUCATED REPUBLICANS AND DEMOCRATS WITHOUT ULTERIOR MOTIVES READ THEM IN EXACTLY THE SAME WAY. THIS PROGRESSIVE BLOGGER IS ON THE SAME PAGE AS THIS REAGAN REPUBLICAN. IT'S NOT THE OTHER PARTY THAT'S THE VILLAIN. ITS MEMBERS OF BOTH PARTIES THAT RUN THE GOVERNMENT FOR THEIR OWN GAIN TO THE DETRIMENT OF THE 99%.


The Real Economic Picture

February 2, 2012 | Original here

If you have any money and you want to understand the lies that “your” government tells you with statistics, subscribe to John Williams shadowstats.com.

John Williams is the best and utterly truthful statistician that we the people have.

The charts below come from John Williams Hyperinflation Report, January 25, 2012. The commentary is supplied by me.

Here is the chart of real average weekly earnings deflated by the US government’s own measure of inflation, which as I pointed out in my recent column, Economics Lesson 1, understates true inflation.


This chart (below) shows the behavior of inflation as measured by “our” government’s official measure, CPI-U (bottom line) and John Williams measure which uses the official methodology of when I was Assistant Secretary of the US Treasury. The gap between the top and bottom lines represents the amount of money that was due to Social Security recipients and others whose income was indexed to inflation that was diverted by the government to wars, police state, and bankers’ bailouts.


This next chart shows the gains that gold and the Swiss franc have made against the US dollar. The Swiss franc is the top line and gold is the bottom. When gold and the Swiss franc rise, the dollar is falling. Notice that during President Reagan’s first term, when I was in the Treasury, gold and the Swiss franc dropped, that is, the dollar rose in purchasing power. Obviously, the supply-side policy that Reagan implemented strengthened the US dollar. It was only with the advent of the Bush policy of endless trillion dollar wars, reaffirmed by Obama, that the US dollar and economy collapsed relative to gold and hard currencies.

The recent drop in the Swiss franc is due to the Swiss government announcing that the country’s exports could not tolerate any further run up in the franc’s value, and that the Swiss central bank would print new francs to accommodate future inflows of dollars and euros. In other words, Switzerland was forced to import US inflation in order to protect its exports.


Here is nonfarm payroll employment. As you can see, the US economy has been in recession for four years despite the easiest monetary policy and largest government deficits in US history.


Here is consumer confidence. Do you see a recovery despite all the recovery hype from politicians and the financial media?


Here is housing starts. Do you see a recovery?


Here is real GDP deflated according to the methodology used when I was in the US Treasury.


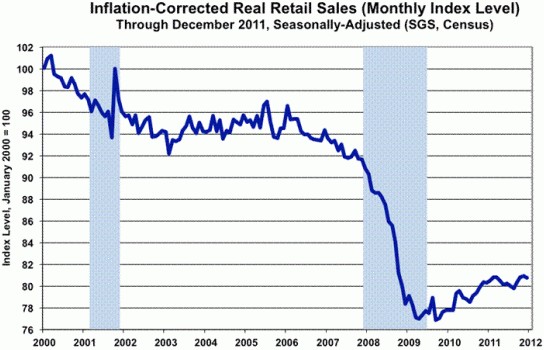
Here is real retail sales deflated by the traditional, as contrasted with the current, substitution-based, measure of inflation.


These graphs courtesy of John Williams make it completely clear that there is no economic recovery. In place of recovery, we have hype from politicians, Wall Street, and the presstitute media. The “recovery” is no more real than Iraqi “weapons of mass destruction” or Iranian “nukes” or the Obama regime’s phony story of assassinating last year an undefended Osama bin Laden, allegedly the mastermind of Islamic terrorism, left by al Qaeda to the mercy of a US Seal team, a man who was widely reported to have died from renal failure in December 2001, a man who denied any responsibility for 9/11.

A government and media that will deceive you about simple things such as inflation, unemployment, and GDP growth, will lie to you about everything.

Friday, October 01, 2010

Floyd Norris: "In previous recessions, there has been widespread pessimism about the overall economy. But this recession was the first since the survey began in 1967 when more people expected their own incomes to fall."


October 1, 2010
The Recession Is Over, but Pessimism Still Reigns

By FLOYD NORRIS

AMERICANS became more pessimistic about their chances for higher incomes during the Great Recession than at any time in the past 45 years. That pessimism has eased, but still remains high.

The consumer confidence index fell in September, according to preliminary figures released this week by the Conference Board. That decline was largely because of lower expectations.

The expectations index is based on three questions about what consumers expect to happen over the next six months — whether business conditions will improve, whether there will be more or fewer jobs, and whether they expect their own incomes to rise or fall. In September, for the first time since July 2009, there were more negative than positive responses to all those questions.

In previous recessions, there has been widespread pessimism about the overall economy. But this recession was the first since the survey began in 1967 when more people expected their own incomes to fall.

Before this recession, no survey ever showed as few as 15 percent of Americans optimistic about their own prospects. But since October 2008, when the financial crisis intensified after the failure of Lehman Brothers, the figure has been below 15 percent. Similarly, the proportion of pessimists had never been as high as 15 percent before the financial crisis, but it has been above that figure for the last two years.

At the height of the financial crisis, in March 2009, less than 8 percent of Americans expected their incomes to improve, while about 24 percent anticipated a decline. The figures released this week showed about 10 percent were optimistic about their incomes, while about 16 percent still expected a fall.

The pessimism in 2009 came as unemployment rose above 10 percent in October, a figure it is still near. But the rate had been higher in 1982, when there was less pessimism. In part, that may reflect the fact that many people who kept their jobs in the recent recession were forced to accept pay cuts, something that had not happened in earlier downturns.

The rise in pessimism has also come as major asset categories have performed poorly. The median sales price of existing homes is lower now than it was five years ago. Before this recession, home prices always rose at a rate of at least 2.5 percent a year over five-year periods, according to data the National Association of Realtors began collecting in 1968.

And despite rising 8.8 percent in September, the Standard & Poor’s index of 500 stocks remains below where it was five years earlier. There was a similar prolonged period of weak stock prices in the 1970s, but stocks were far less important then to most Americans.

Stocks are more important now because more people see their retirement depending on their own investments. That change came as fewer companies offered defined-benefit pension plans and more people had 401(k) defined contribution plans, which were often invested in stock mutual funds. By early 2000 — as the stock market was peaking — 43 percent of household financial assets were in stocks, triple the proportion in the mid-1980s.

The Federal Reserve estimates that Americans had $43.8 trillion in financial assets at the end of June, 15 percent below the figure for September 2007, shortly before the recession began.

Floyd Norris comments on finance and economics on his blog at nytimes.com/norris.